


DevSecOps in Practice for Embedded Systems – Workshop with GitLab
Knowledge boost with hands-on experience
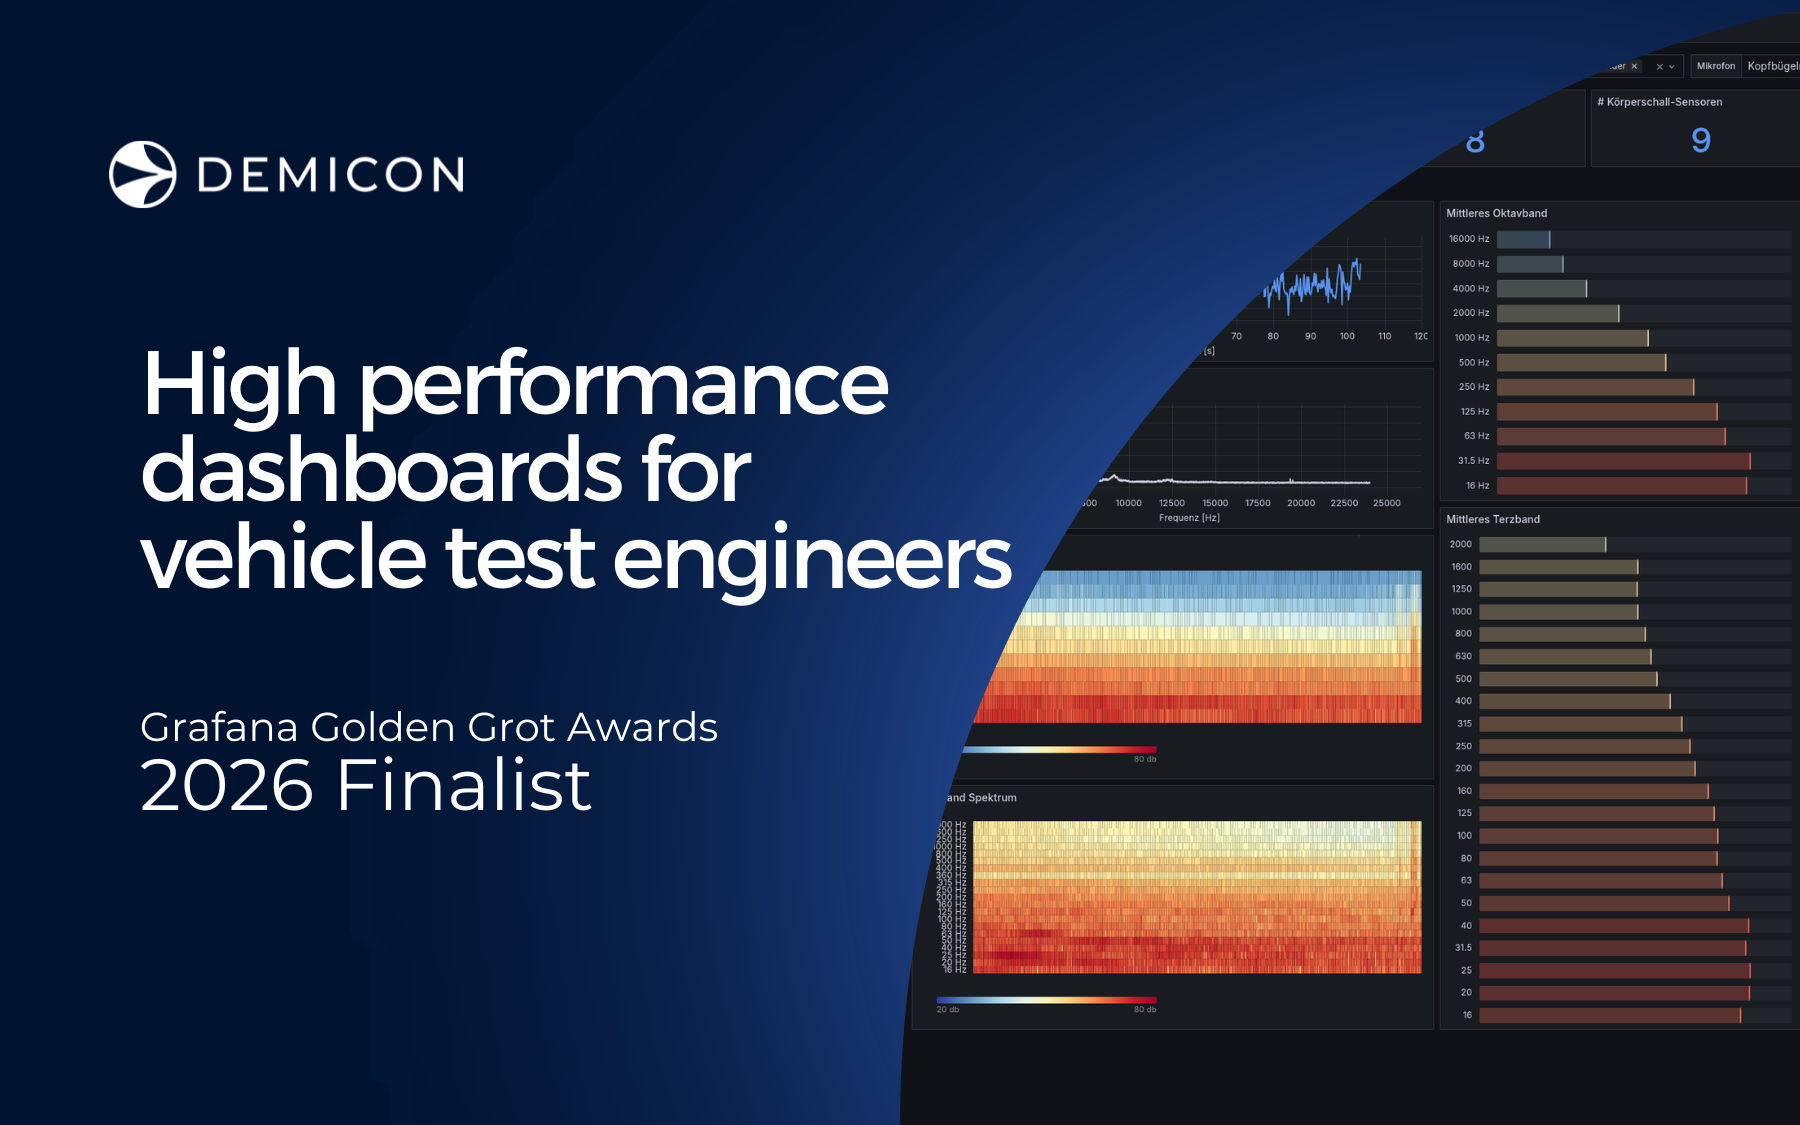
From tool chaos to high performance: Our dashboard for vehicle test engineers at a leading OEM was recognized as a finalist in the global Grafana Community competition. Congratulations to our team!

NVH stands for Noise, Vibration, Harshness: a demanding field in modern vehicle development. Automotive NVH engineers who want to localize specific noises in prototypes at 3,000 RPM often work with specialized NVH software and are traditionally stuck in a "tool chaos." While these tools are powerful for deep-dive analysis, they make it difficult to get a quick overview due to slow loading times and manual search processes across different measurements.
Our task for a leading company in the automotive sector: to develop dashboards that make problems immediately identifiable without diving deep into their specialised software.
NVH measurement data in ADAM ODS format (ATFx) reaches frequencies of up to 48,000 Hz. Since Grafana is not natively built for this, the core of the solution lies in a custom-built data pipeline:
It's not just the range of functions that impresses, it's the ergonomics. We replace fragmented workflows with a user interface for engineers who can't afford any delays.
We have developed high-performance dashboards specifically designed to meet the needs of test engineers. The foundation is a highly scalable AWS architecture that transforms raw test bench data into an interactive analysis environment.
In a central overview dashboard, we synchronise data from 17 high-resolution microphones with the vehicle's ECU. This provides a 360-degree view of the vehicle's acoustic performance. This is equivalent to a digital twin of the measurement setup, which consolidates all relevant information in real time.

This dashboard is optimised for a detailed analysis of individual microphones during an NVH vehicle test. If an engineer notices an anomaly in the overview dashboard, a single click leads directly to the detailed acoustic parameters of the relevant microphone.

To precisely isolate the cause of an acoustic anomaly, relevant measurement signals from the vehicle’s ECU (engine control unit) can be directly added into the analysis. The integrated Melody Range spectrum makes increases in sound intensity at specific frequencies immediately visually identifiable. This transforms abstract data into an intuitive basis for decision-making.
The customer feedback was clear: NVH engineers with over ten years of experience confirmed that this dashboard works significantly faster and more intuitively than their previous tools.
With the right architecture, a data serving layer in combination with Grafana, even highly complex industrial data can be translated into clear visualisations. A complicated problem doesn't need a complicated UI - it needs a better way to look at the data.

Do you have any questions or would like personal consultation? Our expert will be happy to assist you.

Knowledge boost with hands-on experience

In the whirlwind era of digital transformation, industries across the spectrum are awakening to the prowess of Data-Driven Applications. A key player...
.png)
Data-driven decision-making is crucial for the dynamic automotive industry. Automotive Original Equipment Manufacturers (OEMs) are increasingly...